Sunday, August 2, 2009

Post/Pre Sand Volume map


This map shows the shore configuration using a comparison of the pre storm coast subtracted from the post storm coast to show the change in sand volume using the Spatial Analyst raster calculator. The map is more detailed then the Cut/Fill map but the tendencies are the same in both maps. The hurricane moved large amounts of sand from the near shore area up the beach due to storm surge and wave action.

Cut/Fill Raster Image


The Cut/Fill tool in Spatial Analyst shows how Hurricane Ivan changed the configuration of the shoreline. It is apparent that the storm surge pulled large volumes of sand from the near shore area and deposited the sand further up on the beach.

Pre-Hurricane DEM


This LIDAR image of the Gulf Shores area is before Hurricane Ivan struck. My sand volume is 5 percent higher than it would have been if I was able to use the extract tool in Spatial Analyst to crop the image to the size of the shapefile. The software returned an error code 99999 which was a generic error. Further investigation would have been to look at the log file but time was too short so after a few tries such as reboot, reloading of data and changing load order the decision was made to complete the lab as is.

Wednesday, July 29, 2009

Pensacola, Florida Supervised Classification Map


This map was classified and recoded with ERDAS 9.3 using the supervised method. At least 3 training sites were picked for each land use category. Overall, it appears to be more accurate and shows the mix of residential and trees in a close up view. There are still some problems do to the pixel colors of urban and offshore currents being the same thus all being classified as urban. Also, as in the unsupervised map parts of the airport runway are either classified as urban because of the concrete or agriculture because of the color match with the farming areas. Maybe some post-processing editing would be necessary to correct these issues. There may be other tools in ERDAS that could fix the problems too or maybe more training areas would have corrected some of the issues.

Thursday, July 23, 2009

Pensacola Recoded Classification Map


The above satellite image was classified and then recoded using ERDAS 9.3. The ISODATA algorithm was used with 15 classes to be identified. From this the recode process narrowed the number of classes to 8 by combining similar classes.
Although the image roughly portrays the land characteristics on the real ground there are issues. Agricultural areas had roughly the same color as the airport runways so both were identified in the same class. Also, trees look the same whether in an urban or forest area and tree canopies tend to overwhelm parts of the urban area especially in a geographic area with prolific plant growth such as Pensacola, Florida.
These are typical problems in an unsupervised classification. One potential fix would have been to use more classes and a better color scheme to identify the different land use areas. This is primarily true for the vegetation aqnd urban areas that were difficult to differentiate from one another.


Tuesday, July 21, 2009

Image Rectification

Image rectification in GIS is the process of taking raw raster aerial photographs and transforming them into a chosen geographic coordinate system. This process is useful for cleaning up the raw raster photos and removing the distortion created during image acquisition. This distortion is caused by lens distortion, earth curvature, terrain and sensor orientation among others. A successfully rectified image will have more map like characteristics like a flat paper map. Also, if several images of the same area are rectified to the same coordinate system then "time-series" studies can be performed. If a region of photos is rectified then a mosaic can be created orientating all the images so as to create a larger area.
Drawbacks of image rectification would include; time to preprocess the map and then resample, lack of identifiable ground control points(GCP), error when choosing GCP's, image distortion and poor quality of an image that makes it difficult to identify GCP's.

Thursday, July 9, 2009

Thermal Image


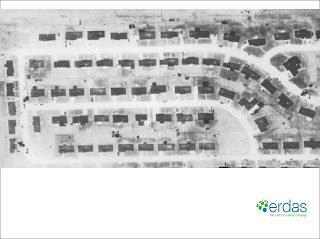
The roads, sidewalks and patios are lighter in color because they are warmer in comparison to the vegetation and other above ground features. This is because concrete on the ground holds heat more efficiently then things above ground or vegetation and this becomes apparent in thermal images taken just before dawn.

Vegetation is generally darker at night because evapotranspiration allows these items to cool at night. The variety of shades is probably because different vegetation has varying moisture content which impacts heat retention.

Storage sheds and autos are dark meaning they are cooler than the surrounding ground. Items above ground with no heat source cool quickly at night and before dawn they are the coldest they will get. Some autos have a white spot in the front indicating the hot engine of autos moved just before the image was taken.

The bright spots on the roofs of the houses are from exhaust of the heating systems. The image was taken in winter at dawn which is the coldest time of the year and the day. In summer it may have been possible to see white spots near the houses on the ground do to the AC units as they expel warm air too.